Showing posts with label visualization. Show all posts
Showing posts with label visualization. Show all posts
Create Flash Visualizations
Monday, August 15, 2011

Flare Website
Flare is an ActionScript library for creating visualizations that run in the Adobe Flash Player. From basic charts and graphs to complex interactive graphics, the toolkit supports data management, visual encoding, animation, and interaction techniques.
What do you think of Flare?
Interactive Data Visualization
Wednesday, March 16, 2011

StatPlanet Website
StatPlanet is a browser-based interactive data visualization and mapping application. Use it to easily and rapidly create visualizations from simple flash maps to advanced infographics.
What do you think of StatPlanet?
Visual Programming with Processing.js
Saturday, January 8, 2011

Processing.js Website
Processing.js is the sister project of the popular Processing visual programming language. It makes your data visualizations, digital art, interactive animations and educational graphs work using web standards without any plug-ins.
What do you think of Processing.js?
Visualize and Explore Large Datasets
Saturday, December 4, 2010

Google Public Data Explorer Website
Google Public Data Explorer makes large datasets easy to explore, visualize and communicate. The charts and maps animate over time. Create visualizations of public data, link to them, or embed them in your webpages.
What do you think of Google Public Data Explorer?
Graph Visualization Software
Sunday, July 11, 2010

Graphviz Website
Graphviz is graph visualization software. It has several main graph layout programs with web, interactive graphical interfaces, auxiliary tools, libraries and language bindings.
What do you think of Graphviz?
Create Dynamic Visualizations
Friday, May 28, 2010

Exhibit 2.0 Website
Exhibit lets you easily create web pages with advanced text search and filtering functionalities, with interactive maps, timelines, and other visualizations. No need for complex database and server-side technologies.
What do you think of Exhibit 2.0?
Scientific Prototyping with FreeMat
Monday, September 21, 2009

FreeMat Website
FreeMat is an environment for rapid engineering/scientific prototyping and data processing. FreeMat provides visualization, image manipulation, and plotting as well as parallel programming.
Graph Visualization with aiSee
Friday, August 14, 2009

aiSee reads a textual graph specification and automatically calculates a customizable graph layout. This layout is then displayed, and can be interactively explored, printed and exported to various graphic formats.
What do you think of aiSee?
Data Visualization with UUorld
Friday, July 24, 2009
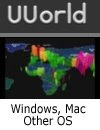
UUorld is a data visualization tool that provides an immersive mapping environment, high-quality data and critical analysis tools. UUorld lets you draw on organized data, explore and grasp complex patterns and deliver new insight with compelling images and video.
What do you think of UUorld?




